Graph Series Options Dialog Box
The Graph Series Options dialog box allows you to adjust the display settings for the graph. You can define the legend labels, the scenario (or scenarios), and the attribute (or attributes) that are displayed in the graph.
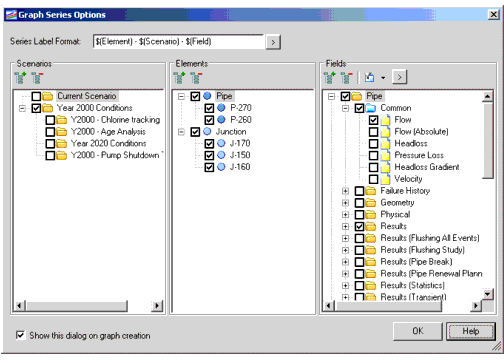
The Series Label Format field allows you to define how the series will be labeled in the legend of the graph. Clicking the [>] button allows you to choose from predefined variables such as Field name and Element label.
The Scenarios pane lists all of the available scenarios. Check the box next to a scenario to display the data for that scenario in the graph. The Expand All button opens all of the folders so that all scenarios are visible; the Collapse button closes the folders.
The Elements pane lists all of the elements that will be displayed in the graph. The Expand All button expands the list tree so that all elements are visible; the Collapse button collapses the tree.
The Fields pane lists all of the available input and output fields. Check the box next to a field to display the data for that field type in the graph. The Expand All button opens all of the folders so that all fields are visible; the Collapse button closes the folders. The Filter by Field Type button allows you to display only Input or Output fields in the list. Clicking the [>] button opens a submenu that contains all of the available fields grouped categorically.
Normal graphs don't show any time varying results from transient simulation - all you can see are the extreme results like Pressure (Maximum, Transient). To see these time-varying results you will need to use the Transient Results Viewer.
The Show this dialog on profile creation check box is enabled by default; uncheck this box to skip this dialog when a new profile is created.
For any given element, the most commonly used fields are displayed underneath a Common folder, colored blue (see screenshot above). To graph all of these attributes you can simply check the Common box.